Identifying Risk of Type II Diabetes
Diabetes is the 7th leading cause of death in the US. Roughly 9.3% Americans have it. Most importantly, type II diabetes often go undetected, because it is largely asymptomatic in its early stages - about 25% of people with type II diabetes don't know that they have it.

Predicting patient's risk for diabetes can help with early disease detection and treatment. In this analysis I set out to develop a risk model for type II diabetes. I utilized a set of de-identified electronic medical records data from Practice Fusion - you can find it through this kaggle challenge.
Summary of Data
The dataset contains 5 years of medical records for approximately 9000 patients. These medical records contain a pretty comprehensive coverage of patients' history - including their ICD9 diagnoses, lab results, prescription/ drug history, blood pressure/BMI, visiting physician, allergies, smoking status, etc.
Key Modeling Features
After much research and exploratory analysis I decided to narrow down my features to these following categories:
- BMI (Presence of Obesity)
- Blood Pressure
- Age/Gender
- Co-existing Conditions Presenting Risk for diabetes
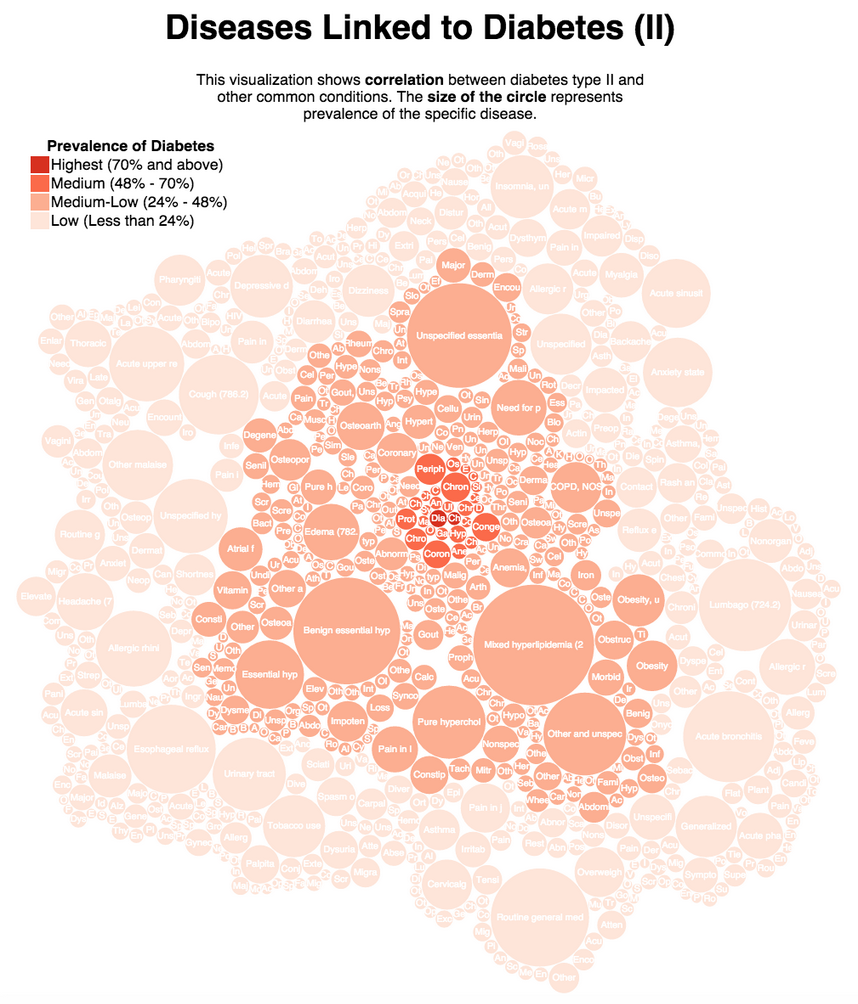
One of the complexities I faced with #4 was - which diseases are significantly correlated with Diabetes? There are about 3000 unique ICD9 codes in the dataset, should I include all of them in my model in a brute force manner, or should I selectively combine/group them? Which method will let me optimize my accuracy?
I initially tried to do this via research - I read through a bunch of medical articles and created a list of diseases that are known to be correlated to diabetes. The wiki page on Type II Diabetes gives a good summary of some of the major complications. The issue with this approach is that I could not be certain whether I was comprehensive - unless I was actually a doctor and/or had infinite research time.
Instead, what if I let my data tell me what diseases are correlated to diabetes? To help visualize this - I created this graphic below to illustrate the diseases that are correlated to diabetes. Click on the picture to go to the interactive visualization page.
I ended up choosing most of the diseases shown the darker circles from the visualization.
In my final model I included a total of 262 features.
The dependent variable predicted was a "yes" or "no" indicator for whether a patient has type II diabetes, as defined by ICD9 codes 250, 250.0, 250.0 or 250.2 (e.g., 250, 250.0, 250.00, 250.10, 250.52, etc)
Modeling Results
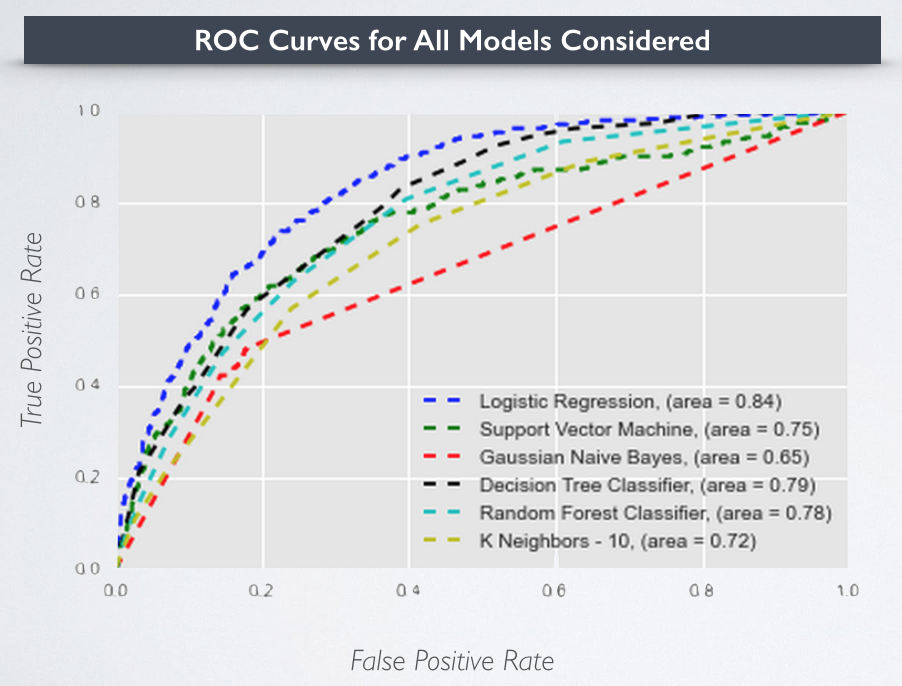
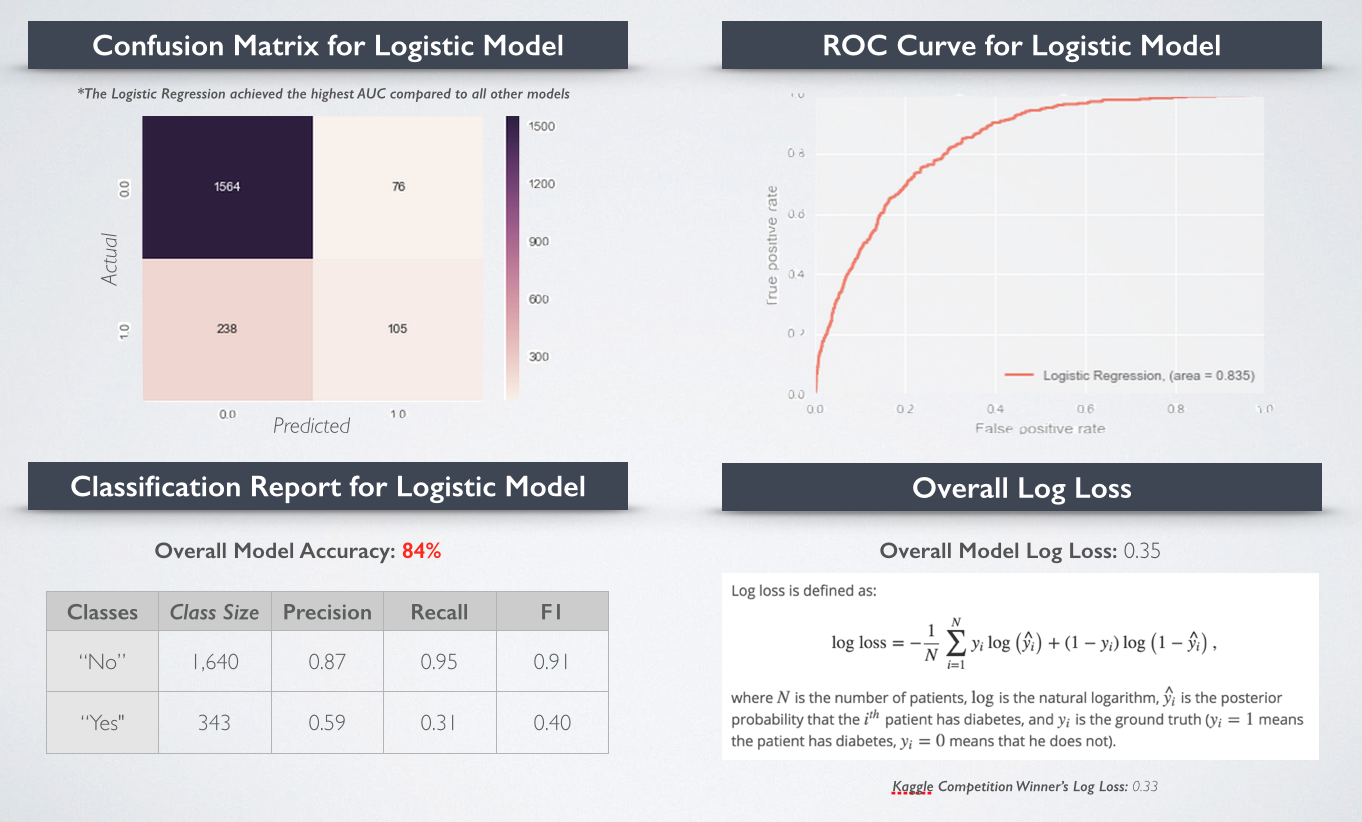
I considered a variety of classification algorithms - my Logistic Regression model turned out to be the best performing one in terms of AUC (area under the curve for ROC).

I was able to achieve a final modeling accuracy of 84% for predicting whether or not a patient has diabetes based on their past 5 years of medical activity records. In real life implementation, I would favor moving toward the right side of the ROC curve, as I would rather have more false alarms in exchange for identifying more people that truly have the disease (higher false positive and higher true positive rates through setting lower thresholds). My model's final log-loss rate was 0.35, compared against the Kaggle challenge winnter's 0.33.

Now that we understand what causes diabetes ... time to exercise??? *cue to nag husband :)

